
Everything Shopify Stores Need to Know About Google Analytics
Have you ever wondered who your most valuable customers are? Or wanted to better understand what sways them to make a purchase when interacting with your Shopify site?
Luckily, today’s online retailers can gain unparalleled insights into what makes their customers tick.
And one of the most popular eCommerce analysis tools for doing this is Google Analytics for Shopify.
Google Analytics: More Than Just a Monitoring Tool
Many marketers think of Google Analytics as a tool for monitoring site performance.
Granted, it’s great for tracking website visitors, gathering demographic data, and seeing which landing pages are viewed most.
But it also comes with a suite of tools for Shopify designed to give you a competitive edge.
You can track the flow of customer traffic, see how promotions influence revenue, and identify the most common points where customers leave your site.
It’s an increasingly popular tool for eCommerce companies, whether they’re just starting out or own a more established Shopify store.
In this comprehensive guide, we’ll explain everything you need to know about Shopify Google Analytics.
We’ll explore the benefits and go through a step-by-step guide to using integrated reports and measuring metrics to help you succeed.
Let’s get started.
The Importance of Learning About Google Analytics
While your Shopify dashboard displays sales and product data, you have to go deeper if you want to accurately tweak your marketing and sales tactics. Sometimes, the cookie-cutter Shopify reports just don’t cut it. You need a more holistic business intelligence tool.
This is what Google Analytics offers.
Data analytics has become increasingly central to everything that we do in the world of eCommerce.
Whether it’s performing a SaaS competitor analysis to improve SEO or conducting a heatmap analysis of your site to understand user behavior — the ability to monitor and scrutinize data means you can now make more accurate decisions for your business.
Google Analytics gives you the insights you need to take a tailored approach to your business. By setting up eCommerce events on your site, you’ll have access to specific metrics to help analyze data around how customers interact with your online store.
These measurements include a range of analytical services, such as tracking key performance indicators (KPIs) like user interactions and purchases, identifying patterns in engagement, and producing information about visitor demographics.
Without Google Analytics, you’re taking a stab in the dark. You won’t know whether your Facebook Shopping ads are resulting in sales. Or whether a slow-to-load checkout page is leading to abandoned carts.
With Google Analytics, you’ll have the answers. You’ll get a bird’s-eye view of where traffic is coming from, what marketing tactics are most effective, where engagement is high or needs to be improved, and identify new opportunities for driving traffic.
That said, it’s not just about linking GA with your Shopify store — but we’ll explain how to do that below.
You need to learn as much as you can about Google Analytics for eCommerce. Rather than just scratching the surface of the data, you have to make the most of the expert insights it offers.
Benefits of Google Analytics for Shopify Stores
Before we explain how to start using GA, let’s explore the biggest benefits of Google Analytics for Shopify stores:
1. It Provides Better Audience Insights
One of the most valuable benefits of using Google Analytics is having in-depth, accurate, and up-to-date information about your audience. This is true for both individual user behavior and more general demographic details.
You can track every action that a user takes on your site. Analyzing which pages they visit the most will tell you which products are most appealing. Evaluating time spent on a page is a good indication of a potential customer’s interest level.
Google Analytics is also an excellent tool for producing a complex and comprehensive understanding of your audience demographics. There are the basics, like age, gender, and location of users. But you can also go deeper to identify what devices they’re shopping from and the specific interests of in-market segments.
This is crucial for refining your email marketing campaigns by targeting specific demographics, for instance. You can segment your audience according to this data, allowing you to produce better eCommerce personalization for customers.
2. It Makes Tracking Traffic, Triggers, and Conversions Easier
If you owned a physical shop, it would be fairly simple to track who came in and out, what they purchased (or didn’t), and how much they spent. Gauging this with a digital storefront can be trickier, which is where tracking events is hugely beneficial.
GA’s conversion tracking feature allows you to monitor various behavioral factors that influence how, why, and where users make purchases. This includes:
- Identifying peak activity periods
- Revealing patterns about how users move from page to page
- Pinpointing where users drop off in the customer journey
- Gauging which pages are your highest converters
- Evaluating how many site visits result in conversions
You might notice that web traffic drops off on a certain page, for instance. But you can rectify this by improving the engagement or technical quality of that page.
3. It Improves Content Performance Evaluation
If you run a marketing campaign or trial a new type of content (such as a video post), you’ll want to know whether it was successful. After all, there’s no point repeating anything that doesn’t work well!
By tracking user interactions with content, you can see how it impacts key metrics like time spent on page or conversion rates. This will let you get the best return on investment (ROI) from your campaigns.
The Google Analytics Acquisition report puts the numbers in front of you. You can see how users end up at your online store to determine which marketing efforts result in the most sales.
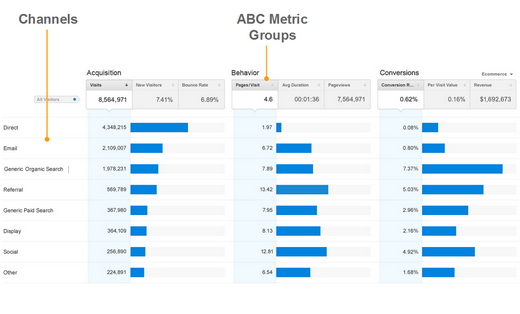
Analyzing this type of information means you can tweak your marketing strategy and put more effort into the channels that drive the most revenue.
4. It Offers Real-Time Reporting
Many of the tools Google Analytics offers are available with real-time reporting capacities. This means that data is collected, processed, and analyzed as it appears, so you’ll see this information as events happen.
With access to real-time reporting, you can stay on top of any sudden changes in web traffic. This could be a clear sign of a technical issue with your site, for example. Access to this data means that you can get things back up and running as quickly as possible.
5. It Improves Search Engine Optimization
Shopify SEO (Search Engine Optimization) is a vital part of any successful eCommerce business. It’s very difficult to attract new customers if you’re not showing up in search engine results, and this seriously limits the potential of your business to grow rapidly and produce higher levels of turnover.
With Google Analytics, you’ll have a much better understanding of your website and its performance. This can be crucial information as you look to boost your SEO.
A great way to do this is by looking at your most popular pages and increasing the quality of that content. You can include more effective keywords, so that these high-performing pages are also high-performing from an SEO perspective.
6. It Enhances the User Experience
Ultimately, if you want your customers to continue buying from your eCommerce business, you’ll need to make sure that their experiences are as good as possible when they’re using your website. But that’s impossible if you have no data on exactly how they’re using your site.
By tracking interactions along the user journey and creating purchase reports, you can immediately identify areas of your site where barriers prevent customers from completing a transaction.
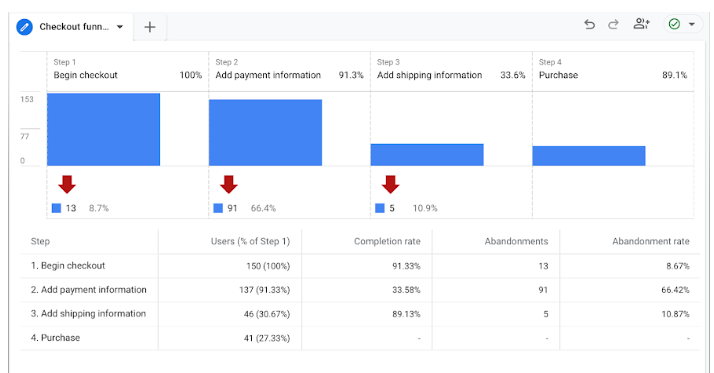
For example, perhaps your cart abandonment rate is high. By customizing your Google Analytics report, you can create and view your specific checkout funnel and take necessary action.
It might be that you need to provide more payment options or offer a guest checkout for people who don’t wish to set up an account.
eCommerce Metrics to Measure with Google Analytics
It’s one thing to say you can get great insights with GA, but you need to understand which metrics to track so you get the right data.
Google Analytics categorizes metrics into two types of quantitative data.
1. Event-Scoped Metrics
An event-scoped metric counts the number of times a visitor triggers an eCommerce event on your online store. Events are actions a user takes on your website.
In the context of Google Analytics, events include:
- Add to cart
- Checkout
- Item-list click events
- Item-list view events
- Item view events
- Promotion clicks
- Promotion views
- Purchases
- Quantity
- Refunds
2. Item-Scoped Metrics
Item-scoped metrics measure the number of times someone interacts with an item within an eCommerce event.
Let’s take the “refund” event as an example.
A shopper buys four of the item “Photo Frame Oak Black” and two of the “Plant Pots Ceramic Blue” from your store. They choose to return two of the photo frames and one of the plant pots.
The event-scoped metric would be one, as they’ve only triggered one event, which is to make a return. However, the item-scoped metric for the photo frames would be two, and the item-scoped metric for the plant pots would be one.
The beauty of Google Analytics, though, is that you can dive further into both event- and item-scoped metrics by creating Explorations.
With this report, you might see that you’ve sold a total of 1,497 Plant Pots Ceramic Blue.
By adding in columns for additional metrics such as Total Purchasers, you’ll notice that 840 customers are responsible for those sales.
5 Essential Google Analytics eCommerce Reports for Deeper Insights
The number of Google Analytics reports can be quite overwhelming.
So, here are a few essential ones for eCommerce owners to get started with:
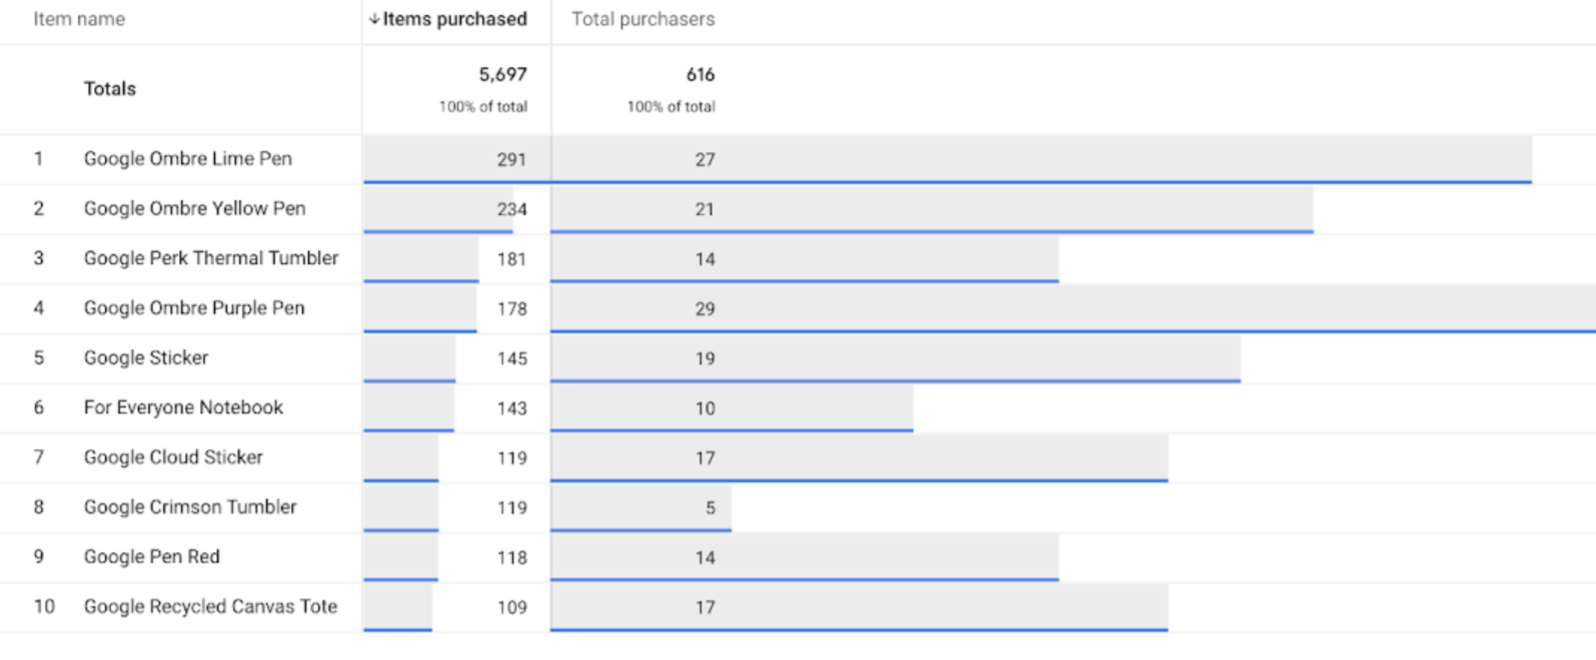
- Purchase. Get a clear idea of how specific products or product categories are performing, broken down by item name or brand and viewed by metrics like views, add-to-carts, and purchases.
- Acquisition. Identify which campaigns or channels are driving the most traffic, conversions, and revenue, whether it’s Google paid ads, organic search, or social media.
- Checkout Journey. If you’re struggling with low conversion rates or high cart abandonment rates, this report offers insights into the number and percentage of users who completed each step in your funnel to highlight bottlenecks in the checkout process.
- Engagement. Monitor user views and sessions over time to determine which pages people visit most and which onsite elements they interact with.
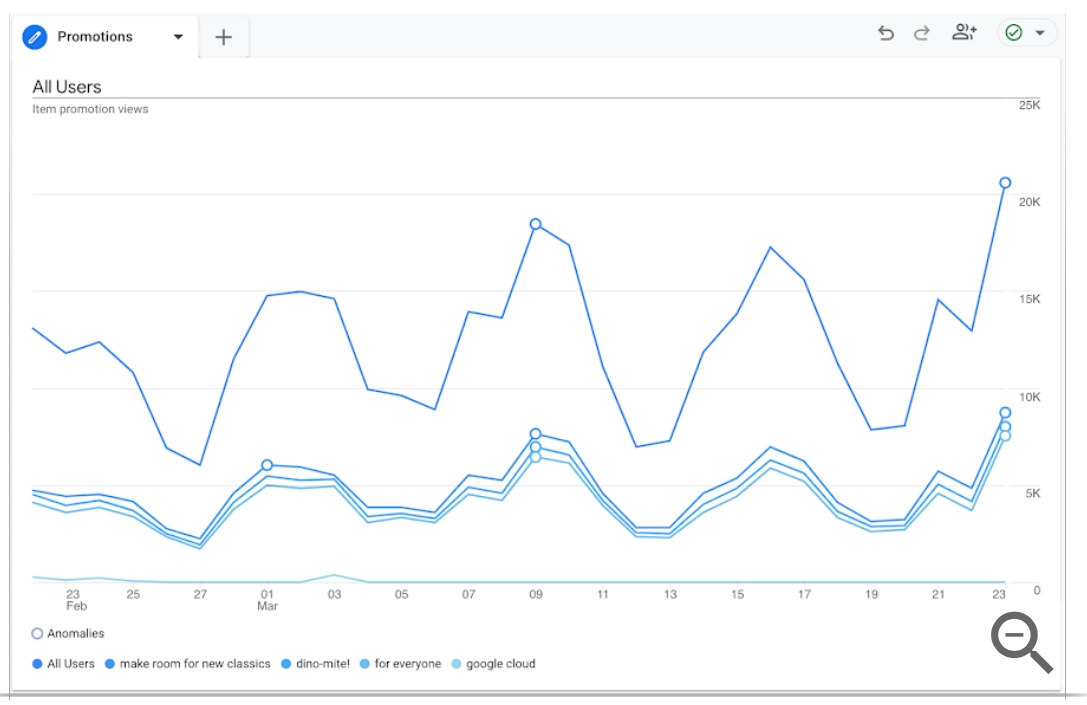
- Promotions. If you offer a lot of incentives, this report will show you what impact they have on purchases and revenue. You can view several metrics, including click rate, items added to cart, items viewed, and items purchased.
How to Use Google Analytics with Your Shopify Store
So, how can you get started with using Google Analytics to support your Shopify store? Here are our top tips for starting that process:
It might sound obvious, but you can’t begin getting the benefits of Google Analytics without an account! To get started, simply find Google Analytics in the Google Marketing Platform (or using a search engine) and sign up with your Google account.
Next, you need to link it to your website. Add your store’s URL to your account and complete the details. You’re now ready to begin collecting data.
2. Integrate Google Analytics with Shopify
To make sure that you get as many tools designed for eCommerce as possible, it’s vital that you add your Google Analytics account to your Shopify store. Find your tracking ID or Google tag from your account information.
Next, go to the administration dashboard and find the dedicated Google Analytics section. Simply paste your tracking ID or Google tag into this section to link your Shopify store to Google Analytics. You can now access all of its eCommerce features.
3. Enable eCommerce Tracking
Now, you need to activate eCommerce tracking within your Google Analytics settings, which will give you access to key eCommerce data such as transaction and revenue information.
Go to your Google Analytics Admin settings and find the eCommerce settings section, where you’ll need to enable both eCommerce and enhanced eCommerce reporting. This should be followed up in Shopify: click the “Use Enhanced eCommerce” box in your settings to complete the process.
Now Google Analytics will automatically start tracking and reporting the performance of your eCommerce Shopify store so you can make better decisions about the future of your online business.
4. Access Google Analytics Reports
With all the technical details sorted, it’s now time for you to make the most of the insights offered by Google Analytics. We explored a few types of data reports above, so take time to explore these reports and what they tell you in line with your goals.
For example, if you’ve started a content marketing strategy, you probably want to know what impact your blog posts are having on conversions. So use acquisition reports to determine which posts have the best engagement or conversion rates.
This is incredibly useful for guiding future marketing strategies. Let’s say you operate an eCommerce store selling dog accessories for outdoor enthusiasts. You might notice that blog posts themed around specific products — “How to Fit Our Very Cool Vest,” for example — don’t perform particularly well.
On the other hand, articles with real-life stories about people hiking or kayaking with their dogs get more engagement. Use this information to refine your marketing strategy.
It might be that you generate more content around this theme to share on social media and your website. You might then identify similar keywords and phrases to write new content around.
But you can also find ways to tie in relevant products to boost conversions, run paid ads on the best-performing posts to drive more traffic to your store, and work with people featured in these stories as brand ambassadors to expand your reach.
Final Thoughts
eCommerce stores today have access to a wealth of information that can help you tailor everything from the products you sell to the promotions you run.
But the answers won’t land in your lap. Shopify businesses need to use analytics and data intelligently. With real-time reporting, a better user experience, and stronger SEO, Google Analytics is arguably the best tool for eCommerce data analytics.
Use our guide to integrate GA with your Shopify platform and start diving in.
To avoid overwhelming you and your team, start by generating reports for the metrics that most matter to you, whether you want to understand more about your audience in general or fine-tune specifics like marketing and promotions.


Nick Brown
Nick Brown is the founder & CEO of Accelerate Agency, the SaaS SEO agency. Nick has launched several successful online businesses, writes for Forbes, published a book and has grown accelerate from a UK-based agency to a company that now operates across US, APAC and EMEA.
Comments
comments
Powered by Facebook Comments